UV 214nm Detection
Peak Area Analysis
Lot-Specific CoA
How to Read an HPLC Chromatogram for Research Peptides: A Visual Interpretation Guide
A visual-first reference for interpreting the peaks, retention times, baseline behavior, and peak-area data on a research peptide chromatogram — the analytical detail a single purity percentage can hide.
Last Updated: June 16, 2026
For most procurement decisions, a researcher opens a Certificate of Analysis, scans for the reported purity percentage, confirms it clears the lab’s threshold, and moves on. The chromatogram printed two lines below — the actual graphical output of the analytical method — often goes unread. That habit quietly discards the most information-dense element on the entire document. Learning how to read an HPLC chromatogram reveals what a single percentage cannot: the shape of the main peak, the position and size of impurity peaks, the flatness of the baseline, and whether the integration was performed on a well-resolved trace or a crowded one. Two reference standards can both report “98% pure” while telling completely different analytical stories the moment you look at the trace itself. This visual interpretation guide walks through every element of a peptide chromatogram in the order you should read them, so that a chromatogram becomes a source of evidence rather than a decorative graphic beneath a number you were going to trust anyway.
- What an HPLC chromatogram plots and why peptide chemists regard it as the gold-standard purity assay
- How to label every feature of a chromatogram — axes, baseline, solvent front, main peak, and impurity peaks
- What retention time tells you, and the critical reason it does not confirm identity on its own
- How to calculate purity from peak area, with a worked example
- How to interpret sharp, tailing, fronting, and split peaks using a reference table
- The procurement red flags that separate a trustworthy vendor chromatogram from a misleading one
1. What Is an HPLC Chromatogram?
An HPLC chromatogram is a two-dimensional plot that records what a detector “sees” as a separated sample leaves an analytical column over time. The horizontal X-axis represents elution time, usually expressed in minutes, while the vertical Y-axis represents detector signal intensity, typically reported in milli-absorbance units (mAU) for UV detection. As each component of an injected mixture passes through the detector flow cell, it produces a deflection above the baseline — a peak. The chromatogram is therefore a time-ordered fingerprint of everything the method was able to separate and detect.
For peptides, the detector almost always monitors ultraviolet absorbance at 214 nm or 220 nm. The reason is structural: the peptide bond itself absorbs strongly in that low-UV region, so detection does not depend on whether the sequence happens to contain aromatic residues. A separate 280 nm channel is sometimes recorded to emphasize tryptophan and tyrosine, but the 214–220 nm range is the workhorse wavelength for purity assessment. Because reversed-phase HPLC separates closely related species with high resolving power and quantifies them reproducibly, peptide chemists regard it as the gold-standard purity assay for research reagents — the analytical method against which a stated purity grade is defined. Authoritative method references are maintained by instrument vendors such as Agilent’s liquid chromatography resources and reagent suppliers like Sigma-Aldrich’s HPLC technical documentation, while standardized analytical terminology is curated by the International Union of Pure and Applied Chemistry (IUPAC).
2. Anatomy of a Peptide HPLC Chromatogram
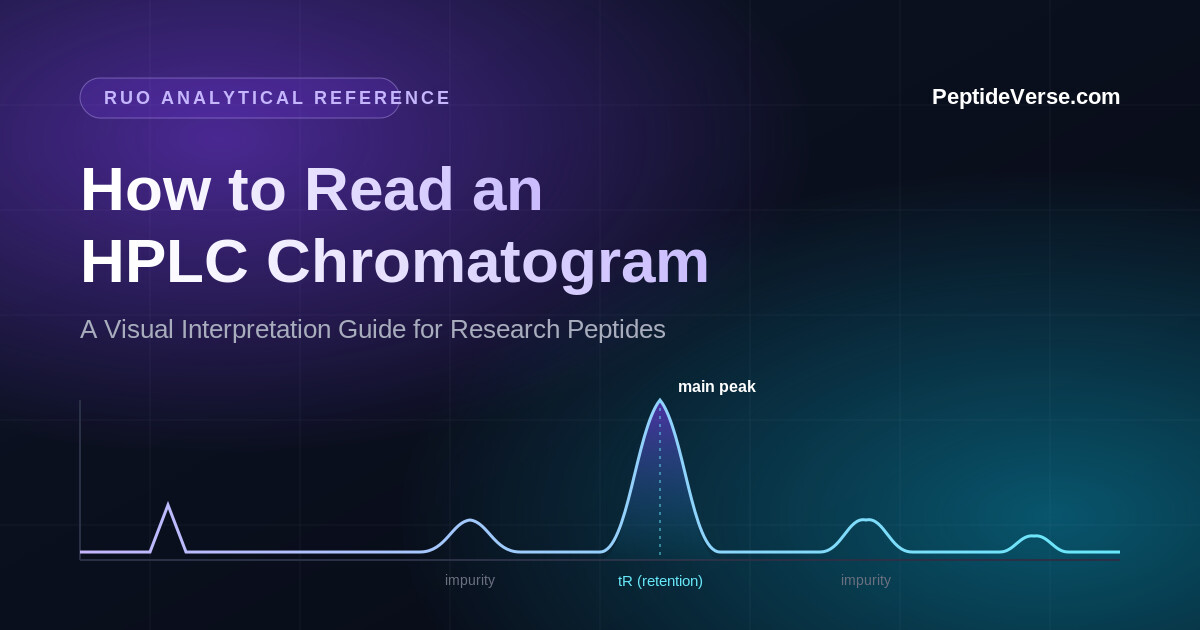
Before interpreting anything, you need to name what you are looking at. The annotated diagram below labels every feature you should be able to identify on sight, using an RUO peptide reference standard as the illustrative example. Read a chromatogram left to right, exactly as the separation happened in time.
Working through the labeled features: the X-axis tracks time in minutes; the Y-axis tracks absorbance in mAU. The baseline is the flat signal level recorded when nothing but mobile phase passes the detector — your reference for everything else. The solvent front (or injection peak) appears very early as unretained material and sample diluent wash through; it is not an impurity and should be excluded from purity integration. The main peak is the dominant feature, representing the target compound. Impurity peaks appear both before and after the main peak. Finally, distinguish peak height (the vertical distance from baseline to apex) from peak area (the integrated region under the curve) — area, not height, is the basis for purity calculation, because a short broad peak can contain more material than a tall narrow one.
3. Understanding Retention Time
Retention time is the interval between sample injection and the apex of a given peak, read directly off the X-axis. It quantifies how long a compound is retained by the stationary phase before the mobile-phase gradient carries it to the detector. More hydrophobic species interact more strongly with a reversed-phase column and elute later; more polar species elute earlier. Within a single, fixed method, retention time is remarkably reproducible — which is why analysts use it as a tracking marker across lots run on the same system.
The critical caveat is that the same peptide will elute at different retention times on different columns, with different gradient slopes, flow rates, column temperatures, or mobile-phase compositions. A reference standard that elutes at 9.8 minutes on one C18 column may elute at 11.2 minutes on another with a different particle size or pore chemistry. This method-dependence is why retention time alone is not identity confirmation. Two entirely different compounds can co-elute at the same retention time, and a real match in retention time between your sample and a reference only suggests consistency under one specific method — never molecular identity. Identity is established by mass spectrometry, which is covered in Section 9 and in our explainer on how peptide purity and identity are measured together.
4. Reading Peak Area and Calculating Purity
Purity on a peptide CoA is, in almost all RUO cases, an area-normalized UV percentage. The integration software measures the area under every detected peak, sums them, and expresses the main peak as a fraction of that total. The governing relationship is straightforward:
Total integrated area = 10,000
% Purity = (9,820 ÷ 10,000) × 100 = 98.2%
The remaining 1.8% of integrated area is distributed across the impurity peaks. Note what this number does and does not say: it is the proportion of detected UV signal attributable to the main peak at the analysis wavelength. It is not a statement about net peptide content, which additionally depends on salt form, bound water, and residual solvent — none of which absorb meaningfully at 214 nm and therefore never appear in this calculation.
This distinction matters at procurement. A reference standard can report 98.2% HPLC purity and still carry a lower net peptide content per milligram once counter-ions and water are subtracted. The two figures answer different questions, and a complete CoA reports both. For the full breakdown of how these grades are defined, see RUO purity grades — 95%, 98%, and 99% explained.
5. Peak Shape — What Sharp, Tailing, and Fronting Peaks Mean
Beyond area, the shape of a peak carries diagnostic information about column condition, loading, and sample homogeneity. The ideal peak is sharp and symmetrical; deviations from symmetry are quantified by the tailing factor (also called the asymmetry factor), where a value near 1.0 indicates an ideal Gaussian profile.
The Gaussian ideal
A symmetrical, bell-shaped peak with a tailing factor close to 1.0 indicates a well-behaved separation: a clean stationary phase, appropriate loading, and a single homogeneous species. This is the shape you want for the main peak.
Tailing, fronting, and split peaks
An asymmetric peak that trails slowly on its back edge is tailing; one that rises with a leading shoulder before the apex is fronting; and a peak with two unresolved apices is split. Each pattern points to a different set of likely causes, summarized below.
| Peak Shape | Visual Signature | Common Causes |
|---|---|---|
| Gaussian (ideal) | Symmetrical bell; tailing factor ≈ 1.0 | Healthy column, appropriate loading, homogeneous analyte |
| Tailing | Sharp rise, slow trailing back edge; factor > 1.5 | Secondary interactions with residual silanols, column aging or degradation, mass overload |
| Fronting | Gradual leading edge, steep back edge; factor < 1.0 | Column overload, chemical heterogeneity, sample-solvent mismatch |
| Split / shouldered | Two unresolved apices or a shoulder on one side | Co-elution of two species, conformational isomers, voids or channeling in the column bed |
Peak shape is not a cosmetic concern. A heavily tailing main peak can bury a small late-eluting impurity inside its trailing edge, and a split peak may signal that what looks like one compound is actually two co-eluting species — a problem no purity percentage will flag on its own.
6. Baseline Quality and Noise
The baseline is the quiet backdrop against which every peak is measured, and its quality directly governs how small an impurity the method can detect. A clean baseline is flat and low, with minimal short-term fluctuation. A noisy baseline shows rapid up-and-down jitter; a drifting baseline slopes steadily upward or downward across the run, commonly from gradient-driven changes in mobile-phase UV absorbance or detector instability.
Noise sets the practical detection limit. Small impurity peaks are only distinguishable when they rise clearly above the baseline fluctuation — typically the analyst requires a signal at least three times the noise amplitude to integrate a peak with confidence. When baseline drift is severe, the integration software must draw a sloped baseline beneath the peaks, and small impurities riding on that slope can be lost or mis-measured. Flag a chromatogram as unreliable when the baseline drift is large enough to obscure the region where small impurities would appear, when noise is comparable in height to the minor peaks themselves, or when the integration baseline has obviously been drawn through real signal. A pristine purity number sitting on top of a turbulent baseline deserves scrutiny, not trust.
7. Identifying Impurity Peaks
Impurity peaks are not interchangeable — their position relative to the main peak hints at their chemical origin, because most peptide-related impurities differ from the target in hydrophobicity in predictable ways. Common patterns in synthetic research peptides include:
- Truncation products. Chains that stopped short during synthesis, missing one or more C-terminal residues. Being shorter, they are often more polar and tend to elute earlier than the main peak.
- Deletion sequences. Chains missing an internal residue. These can elute close to the main peak and are among the hardest impurities to resolve, since a single missing residue may barely shift retention.
- Oxidation byproducts. Most often methionine, cysteine, or tryptophan oxidation, adding oxygen and increasing polarity, so oxidized species typically elute slightly earlier than the parent compound.
- Deamidation byproducts. Conversion of asparagine or glutamine to acidic residues, producing closely eluting peaks just off the main peak that can appear as shoulders.
- Diastereomers. Epimerized residues that create stereochemical variants. Because they are structurally near-identical, they often elute as a closely spaced partner peak adjacent to the main peak.
This positional logic is a working heuristic, not a definitive assignment — only orthogonal analysis confirms an impurity’s nature. For the chemistry behind several of these byproducts, see our reference on peptide degradation pathways including oxidation and hydrolysis, and for how these errors arise during preparation, our guide to common laboratory mistakes that affect peptide purity.
8. Red Flags on a Vendor’s Chromatogram
This is the section to keep open when you are evaluating supplier documentation. A chromatogram is only as trustworthy as its labeling and internal consistency. Regard the following as warning signs that warrant a CoA callback before any material enters a laboratory workflow:
- Reported purity does not match the visible peak area. If the trace shows substantial impurity peaks but the header claims 99%, the numbers and the picture disagree — and the picture is harder to fake than a typed figure.
- Multiple peaks of comparable height. When two or more peaks are similar in size, the “main” peak assignment is ambiguous and the purity figure may rest on a questionable integration choice.
- Heavy baseline drift hiding small impurities. A steeply sloping baseline can swallow minor peaks; a clean number over a drifting trace is not reassuring.
- Missing axis labels, scale, or retention time. A chromatogram with no axes, no time scale, or no marked retention time cannot be independently verified and should be regarded as decorative, not analytical.
- No chromatogram included at all. A purity percentage with no supporting trace is an unverifiable claim. A reference-quality CoA always shows its work.
For a complete procurement framework around supplier documentation, pair this section with our guides on reading a Certificate of Analysis and choosing a research peptide vendor. Peer-reviewed perspectives on reagent quality and reproducibility, such as this Nature Communications discussion of reagent integrity and the broader literature indexed on PubMed, reinforce why analytical transparency belongs at the center of procurement.
9. Cross-Referencing Chromatogram + MS Data
The single most important conceptual point in this guide bears repeating in its own section: HPLC tells you how pure, mass spectrometry tells you what. The chromatogram quantifies relative purity and resolution; it cannot, on its own, confirm that the main peak is the molecule you intended to buy. That confirmation comes from MS, where the observed mass is compared against the theoretical mass calculated from the declared sequence — a topic covered in our reference on peptide molecular weight and amino acid sequences.
A trustworthy Certificate of Analysis therefore presents the two techniques together: an HPLC chromatogram establishing purity and resolution, and an MS spectrum establishing identity. Reading them in tandem closes the loop — purity without identity is an unanchored number, and identity without purity says nothing about how much else is in the vial. Industry analytical references such as Bachem’s peptide documentation and the regulatory framing in our overview of RUO peptides both regard the HPLC-plus-MS pairing as the baseline expectation for a defensible analytical package.
10. Quick Reference Chromatogram Reading Checklist
Use this boxed checklist as a printable bench reference. Run every CoA chromatogram through these six questions before accepting the reported purity at face value.
- Is the chromatogram labeled with both axes, the absorbance scale, and the main-peak retention time?
- Is the baseline flat, low, and free of significant noise or drift?
- Is the main peak Gaussian and symmetrical, with a tailing factor near 1.0?
- Does the purity calculated from peak area match the reported percentage?
- Are the impurity peaks clearly resolved, identified, and quantified?
- Is the chromatogram accompanied by MS data confirming identity?
Frequently Asked Questions
What does retention time mean on an HPLC chromatogram?
Retention time is the elapsed time between sample injection and the apex of a peak, measured along the X-axis in minutes. It reflects how strongly a compound interacts with the column under a defined method. Retention time is highly reproducible within a single method but is not a standalone identity confirmation, because different compounds can co-elute at the same time and the same compound shifts retention time on different columns or gradients.
How is peptide purity calculated from an HPLC chromatogram?
Purity is calculated by area normalization: divide the area of the main peak by the summed area of all integrated peaks, then multiply by 100. For example, a main peak area of 9,820 against a total integrated area of 10,000 yields 98.2%. This is a relative UV-area percentage at the detection wavelength, not an absolute net peptide content value.
What does a tailing peak indicate in peptide HPLC?
A tailing peak rises sharply and then trails slowly back to baseline, producing an asymmetric shape with a tailing factor above approximately 1.5. Common causes include secondary interactions with residual silanols on the stationary phase, column aging or degradation, and column overloading. Heavy tailing can hide small impurity peaks in the trailing edge and complicate accurate integration.
Why is HPLC purity not the same as net peptide content?
HPLC purity is a relative UV-area percentage that describes how much of the detected signal belongs to the main peak. Net peptide content describes the actual mass fraction of peptide in the supplied material after accounting for counter-ions, water, and residual solvents. A reference standard can show high HPLC purity yet a lower net peptide content because salt form and bound water are not visible in the UV chromatogram.
Can an HPLC chromatogram alone confirm peptide identity?
No. An HPLC chromatogram quantifies relative purity and resolution but does not confirm molecular identity. Retention time is method-dependent and non-unique. Identity confirmation requires mass spectrometry, where the observed mass is matched against the theoretical mass calculated from the sequence. A trustworthy Certificate of Analysis pairs the HPLC chromatogram with MS identity data.
What detector wavelength is standard for peptide HPLC analysis?
UV detection at 214 nm or 220 nm is standard for peptides because the peptide bond itself absorbs strongly in that region, allowing detection independent of aromatic side chains. A 280 nm channel is sometimes added to highlight aromatic residues such as tryptophan and tyrosine, but the 214 to 220 nm range is the primary wavelength for purity assessment.
Conclusion: Five Takeaways for Reading Any Peptide Chromatogram
- Read the trace, not just the number. The chromatogram holds peak shape, impurity position, and baseline evidence that a single purity percentage cannot convey.
- Purity is area-normalized, and area is not height. Calculate main-peak area over total area, and confirm the value matches the reported figure.
- Retention time tracks consistency, never identity. Only mass spectrometry confirms what the main peak actually is.
- Peak shape and baseline are diagnostic. Tailing, fronting, splitting, drift, and noise each signal a specific analytical issue worth investigating.
- Demand HPLC and MS together. A defensible CoA shows a labeled chromatogram alongside identity confirmation — anything less is an unverifiable claim.
Analytical Transparency on Every Lot
Every PeptideVerse compound ships with a lot-specific CoA containing a full HPLC chromatogram, peak area data, and MS identity confirmation. Browse our verified RUO peptide catalog for complete analytical transparency.
All products and information on PeptideVerse.com are intended strictly for Research Use Only (RUO) by qualified laboratory professionals. Not for human or animal administration. Not for diagnostic, therapeutic, or clinical use. Not evaluated or approved by the FDA. The buyer assumes full responsibility for lawful procurement, handling, and use in accordance with applicable regulations. For regulatory reference: FDA Guidance on RUO Labeling (2013).